> ## Documentation Index
> Fetch the complete documentation index at: https://docs.hiverge.ai/llms.txt
> Use this file to discover all available pages before exploring further.
# Dashboard
> View the progress of your Hive experiment
To launch the dashboard in a new browser window, use:
```
hive dashboard
```
Pass `--no-browser` to print the URL without opening a browser (useful in headless environments).
## Experiments page
List of all experiments launched by the team, sorted in chronological order. Each card contains information about the experiment name, when the experiment was created, total runtime of the experiment, and the best fitness found by the Hive. You can also add tags or notes to the experiment to help organize them.
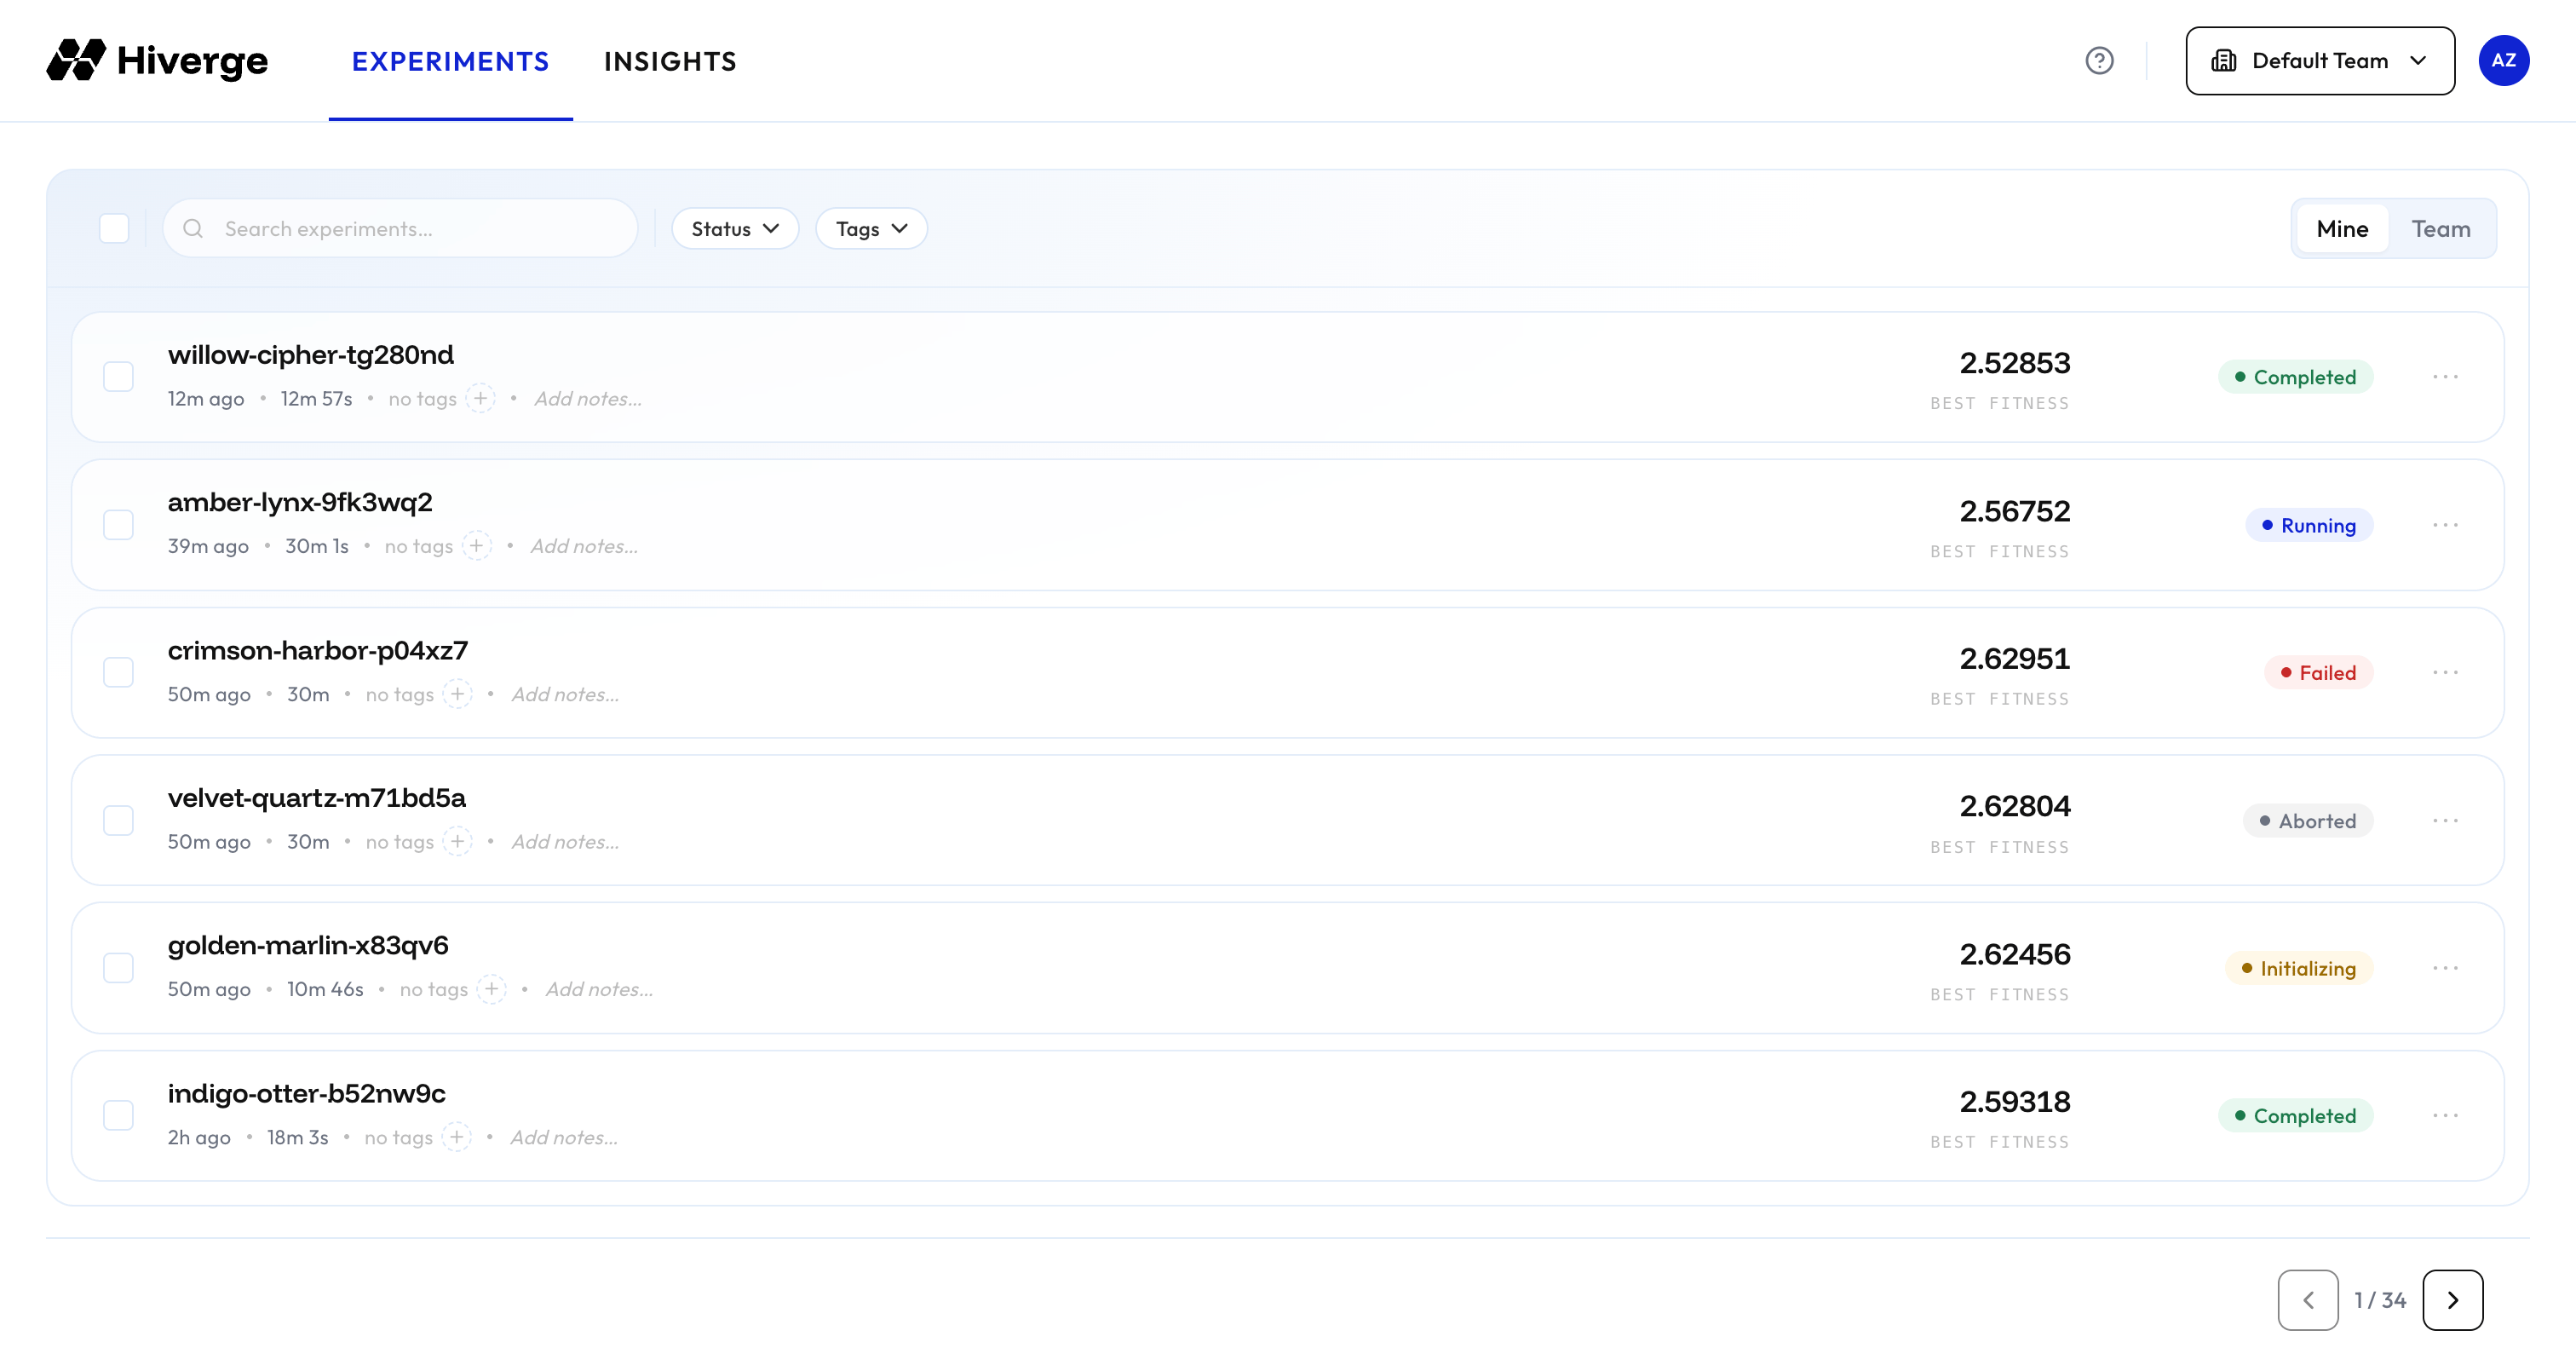 Experiments can have the following statuses:
| Experiment status | Description |
| ----------------- | ---------------------------------------------------------------- |
| Completed | The experiment finished successfully or was stopped by the user. |
| Running | The experiment is currently running. |
| Failed | The experiment ran into an unrecoverable failure. |
| Aborted | The experiment was interrupted before it started running. |
| Initializing | The experiment is initializing. |
Once an experiment has been selected, it opens up a window with additional details about the experiment, split into the following three tabs.
### Overview
The overview provides a high-level summary of the experiment's progress.
Experiments can have the following statuses:
| Experiment status | Description |
| ----------------- | ---------------------------------------------------------------- |
| Completed | The experiment finished successfully or was stopped by the user. |
| Running | The experiment is currently running. |
| Failed | The experiment ran into an unrecoverable failure. |
| Aborted | The experiment was interrupted before it started running. |
| Initializing | The experiment is initializing. |
Once an experiment has been selected, it opens up a window with additional details about the experiment, split into the following three tabs.
### Overview
The overview provides a high-level summary of the experiment's progress.
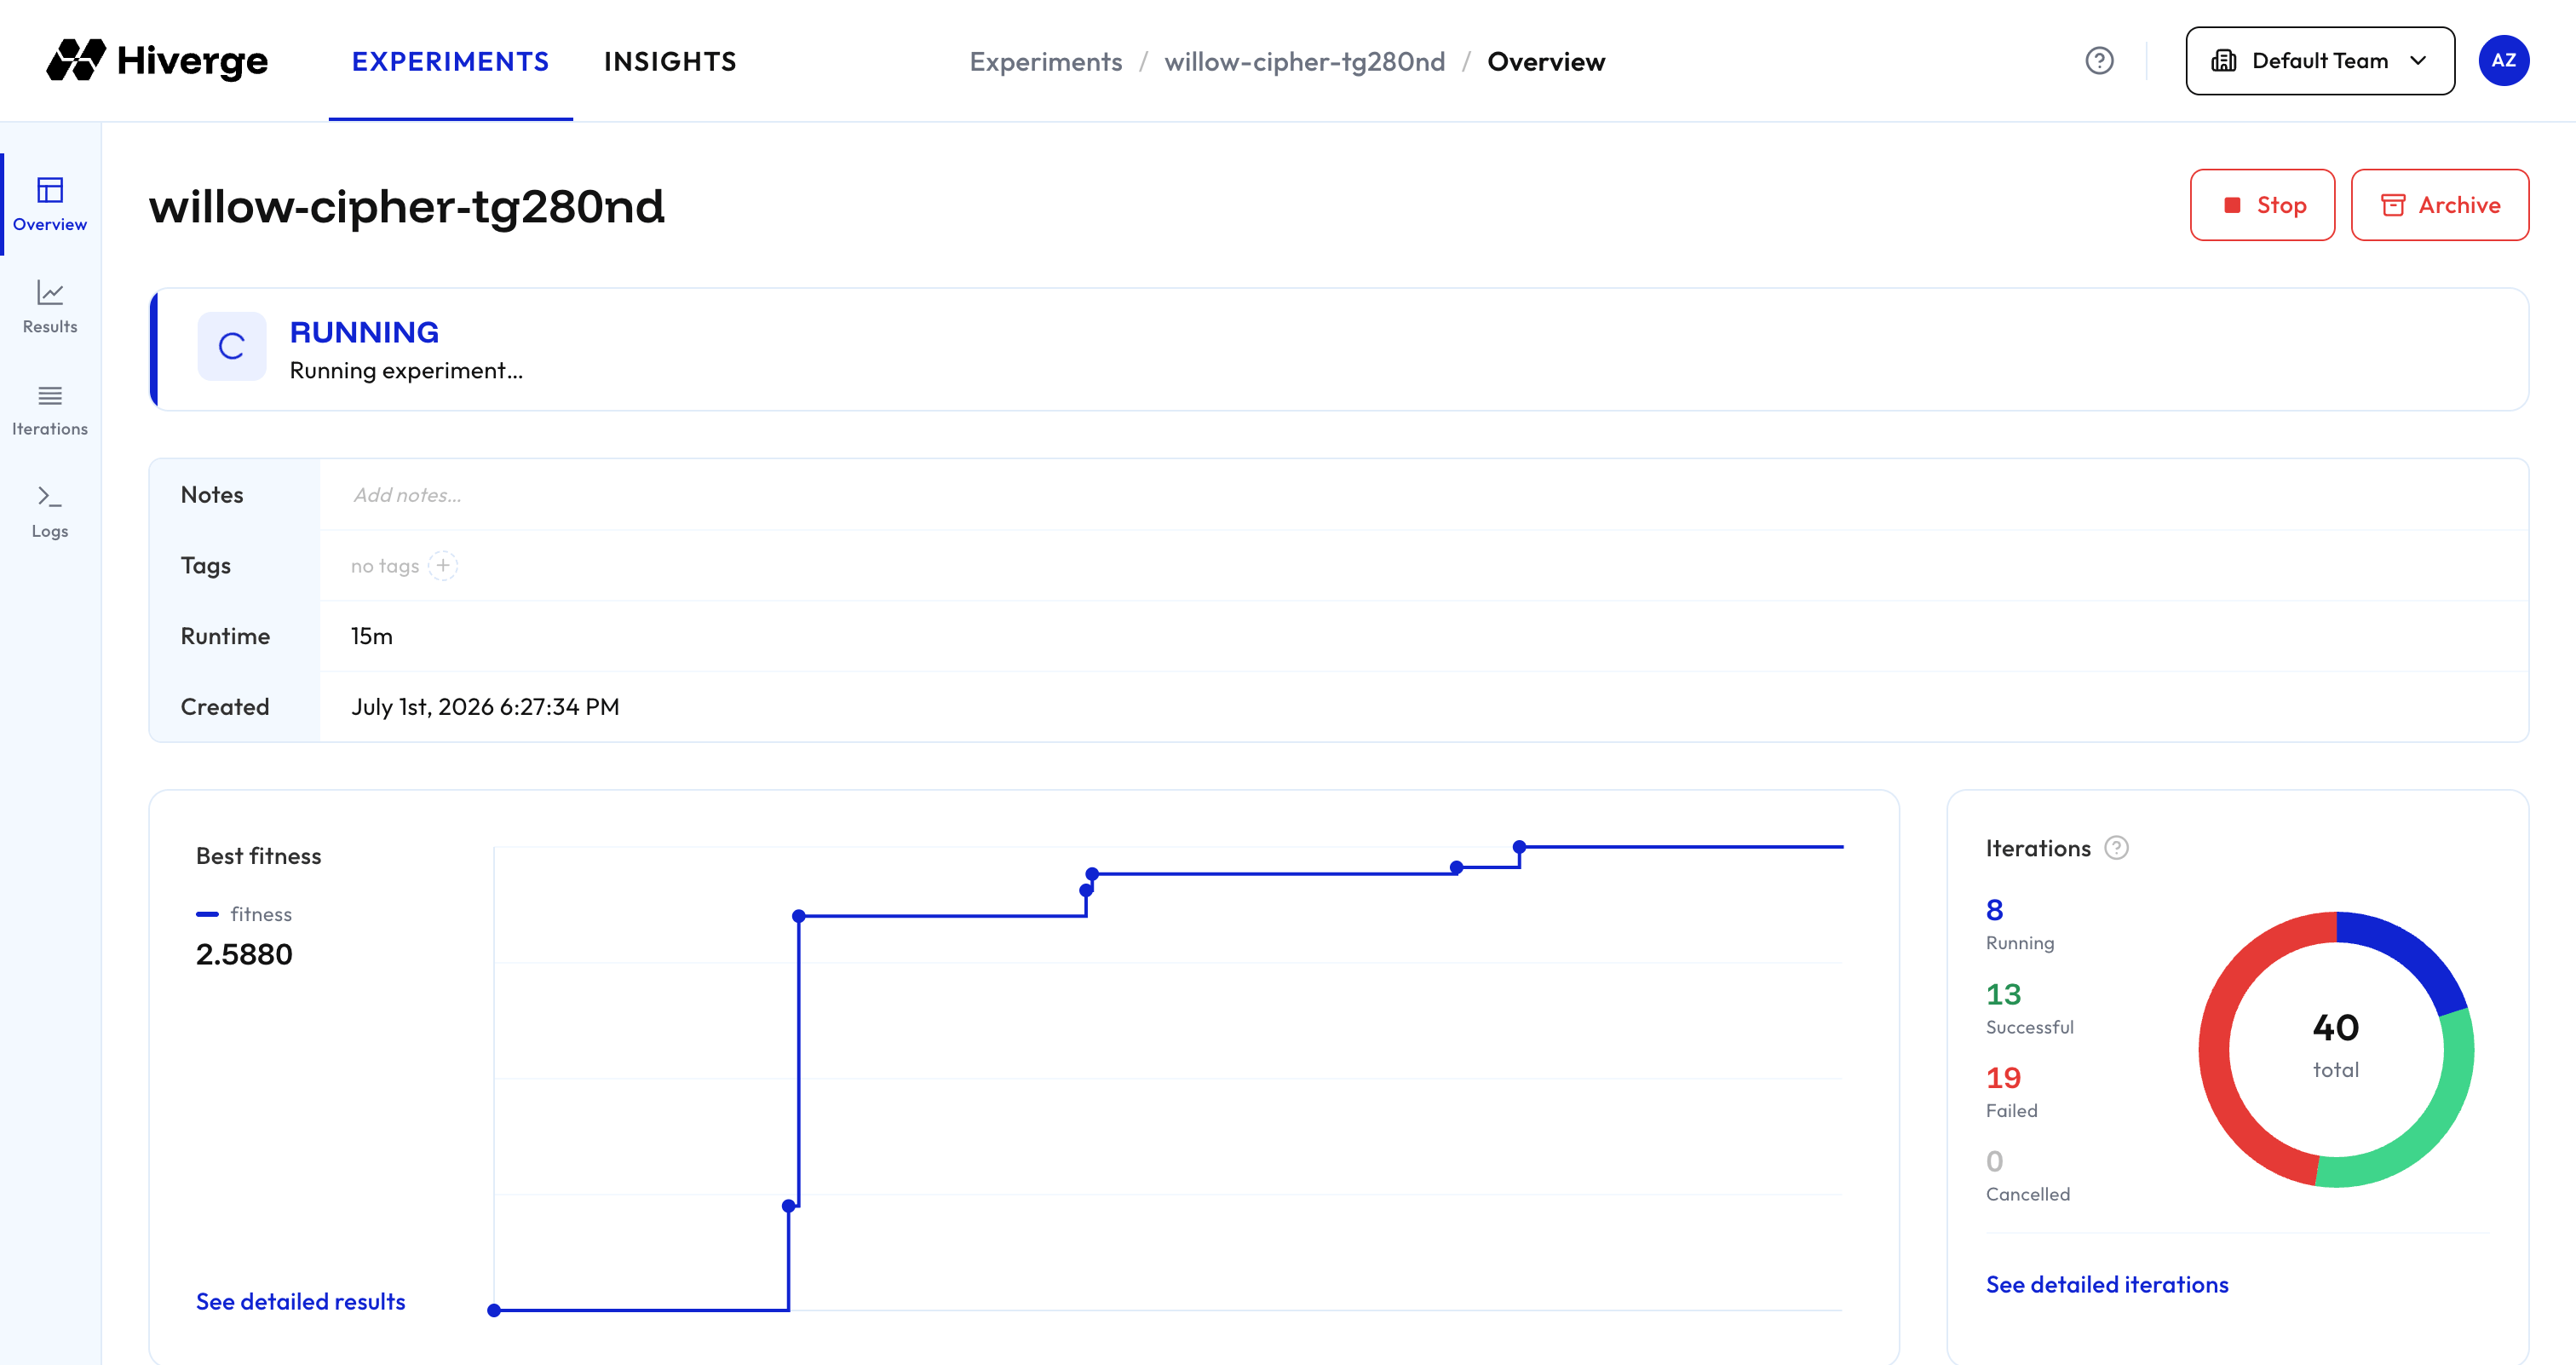 This overview includes the status of the experiment with some additional information about the experiment state, charts summarizing the progress of the experiment, and the configuration file used to launch the experiment.
### Tracking
The tracking tab is an interactive workspace for exploring how the Hive evolves code over time. The evolution chart plots fitness across iterations — hover over a point to see a summary of what the Hive attempted, or select a point to view the corresponding code on the left.
This overview includes the status of the experiment with some additional information about the experiment state, charts summarizing the progress of the experiment, and the configuration file used to launch the experiment.
### Tracking
The tracking tab is an interactive workspace for exploring how the Hive evolves code over time. The evolution chart plots fitness across iterations — hover over a point to see a summary of what the Hive attempted, or select a point to view the corresponding code on the left.
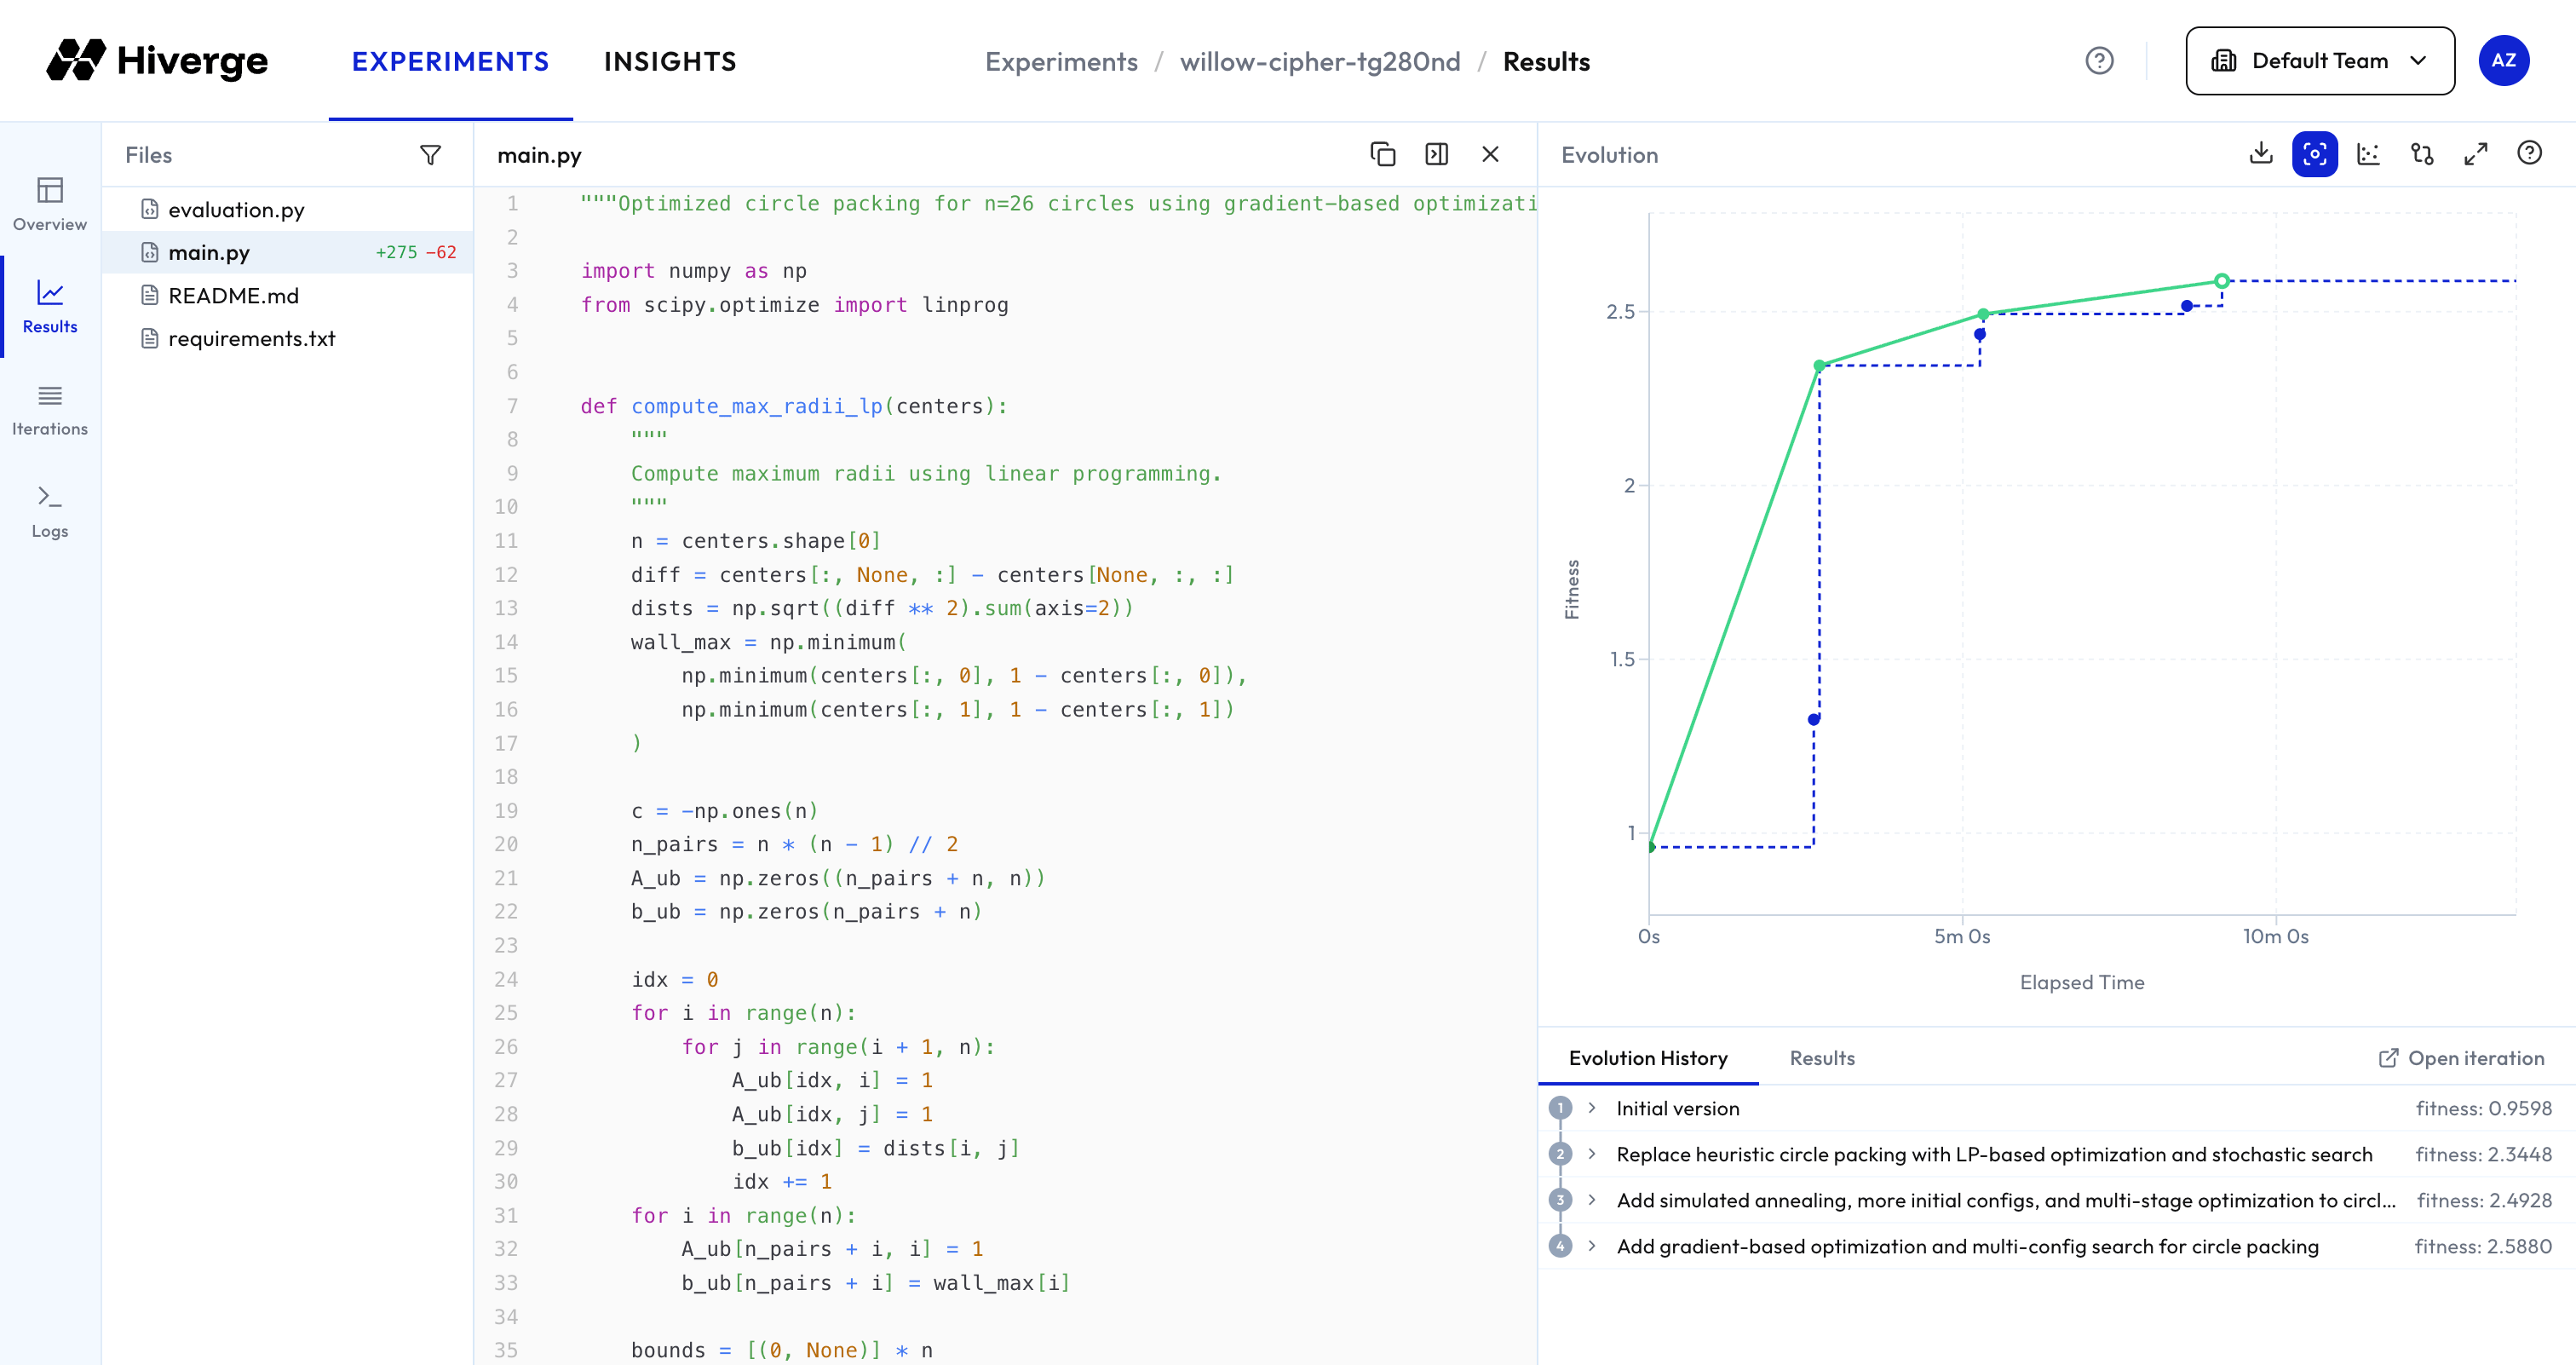 The best-over-time is shown in dark blue. When a point is selected, the full lineage leading up to that point is shown in green. The evolution history also displays a summary of what changes were made at each iteration.
Above the files, the icon can be selected to show only files which have been modified by the Hive.
Above the code, there are a few controls:
* **Copy** — copies the currently selected file to your clipboard.
* **Hide chart** — hides the evolution chart on the left to have more room to view the code.
* **Edit comparison** — in comparison mode (see below), click to change whether clicking a new point on the evolution chart selects a new red or green point.
Above the evolution chart, there are several controls:
* **Download** — download a zip of the repo at the currently selected point.
* **Show full range** — expand viewable range to show all points (by default the y-axis is clipped to show only points better than the initial point).
* **Show all points** — shows all points (by default, only points which are best-over-time and their ancestors are shown).
* **Legend** — colour key for the data points.
* **Expand** — view the chart in full screen.
* **Reset** — clear any zoom selection.
* **Compare** — select two points to view the code diff between them.
The best-over-time is shown in dark blue. When a point is selected, the full lineage leading up to that point is shown in green. The evolution history also displays a summary of what changes were made at each iteration.
Above the files, the icon can be selected to show only files which have been modified by the Hive.
Above the code, there are a few controls:
* **Copy** — copies the currently selected file to your clipboard.
* **Hide chart** — hides the evolution chart on the left to have more room to view the code.
* **Edit comparison** — in comparison mode (see below), click to change whether clicking a new point on the evolution chart selects a new red or green point.
Above the evolution chart, there are several controls:
* **Download** — download a zip of the repo at the currently selected point.
* **Show full range** — expand viewable range to show all points (by default the y-axis is clipped to show only points better than the initial point).
* **Show all points** — shows all points (by default, only points which are best-over-time and their ancestors are shown).
* **Legend** — colour key for the data points.
* **Expand** — view the chart in full screen.
* **Reset** — clear any zoom selection.
* **Compare** — select two points to view the code diff between them.
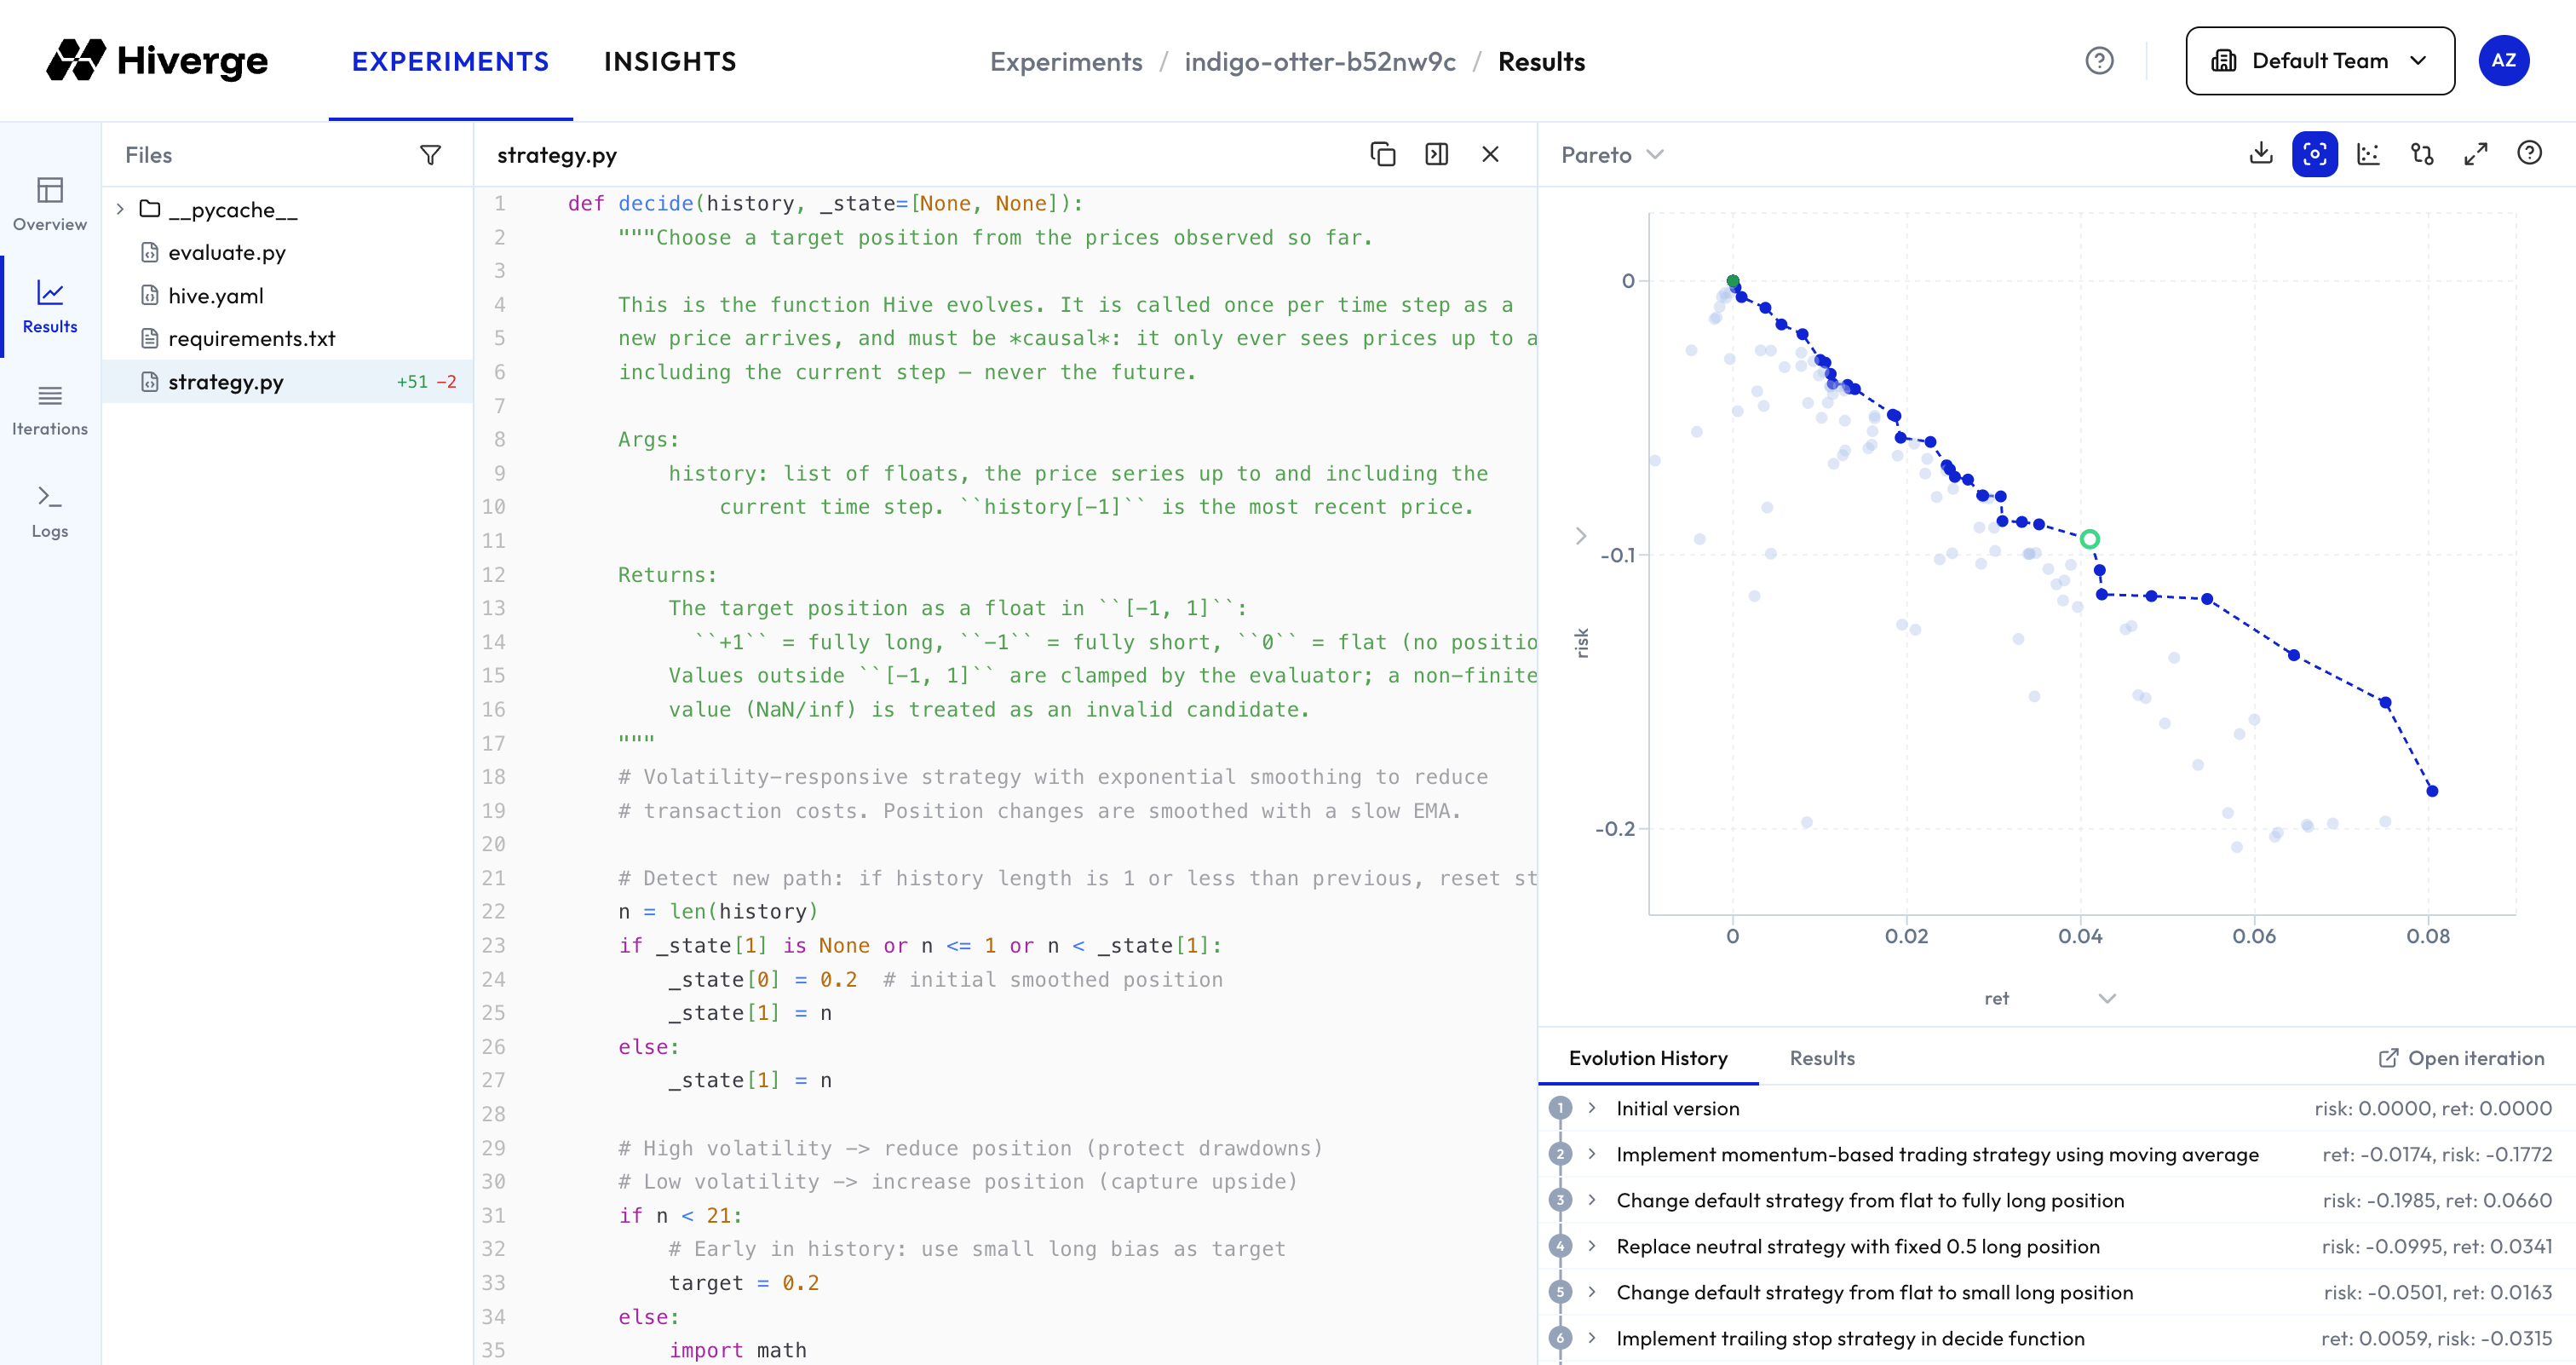
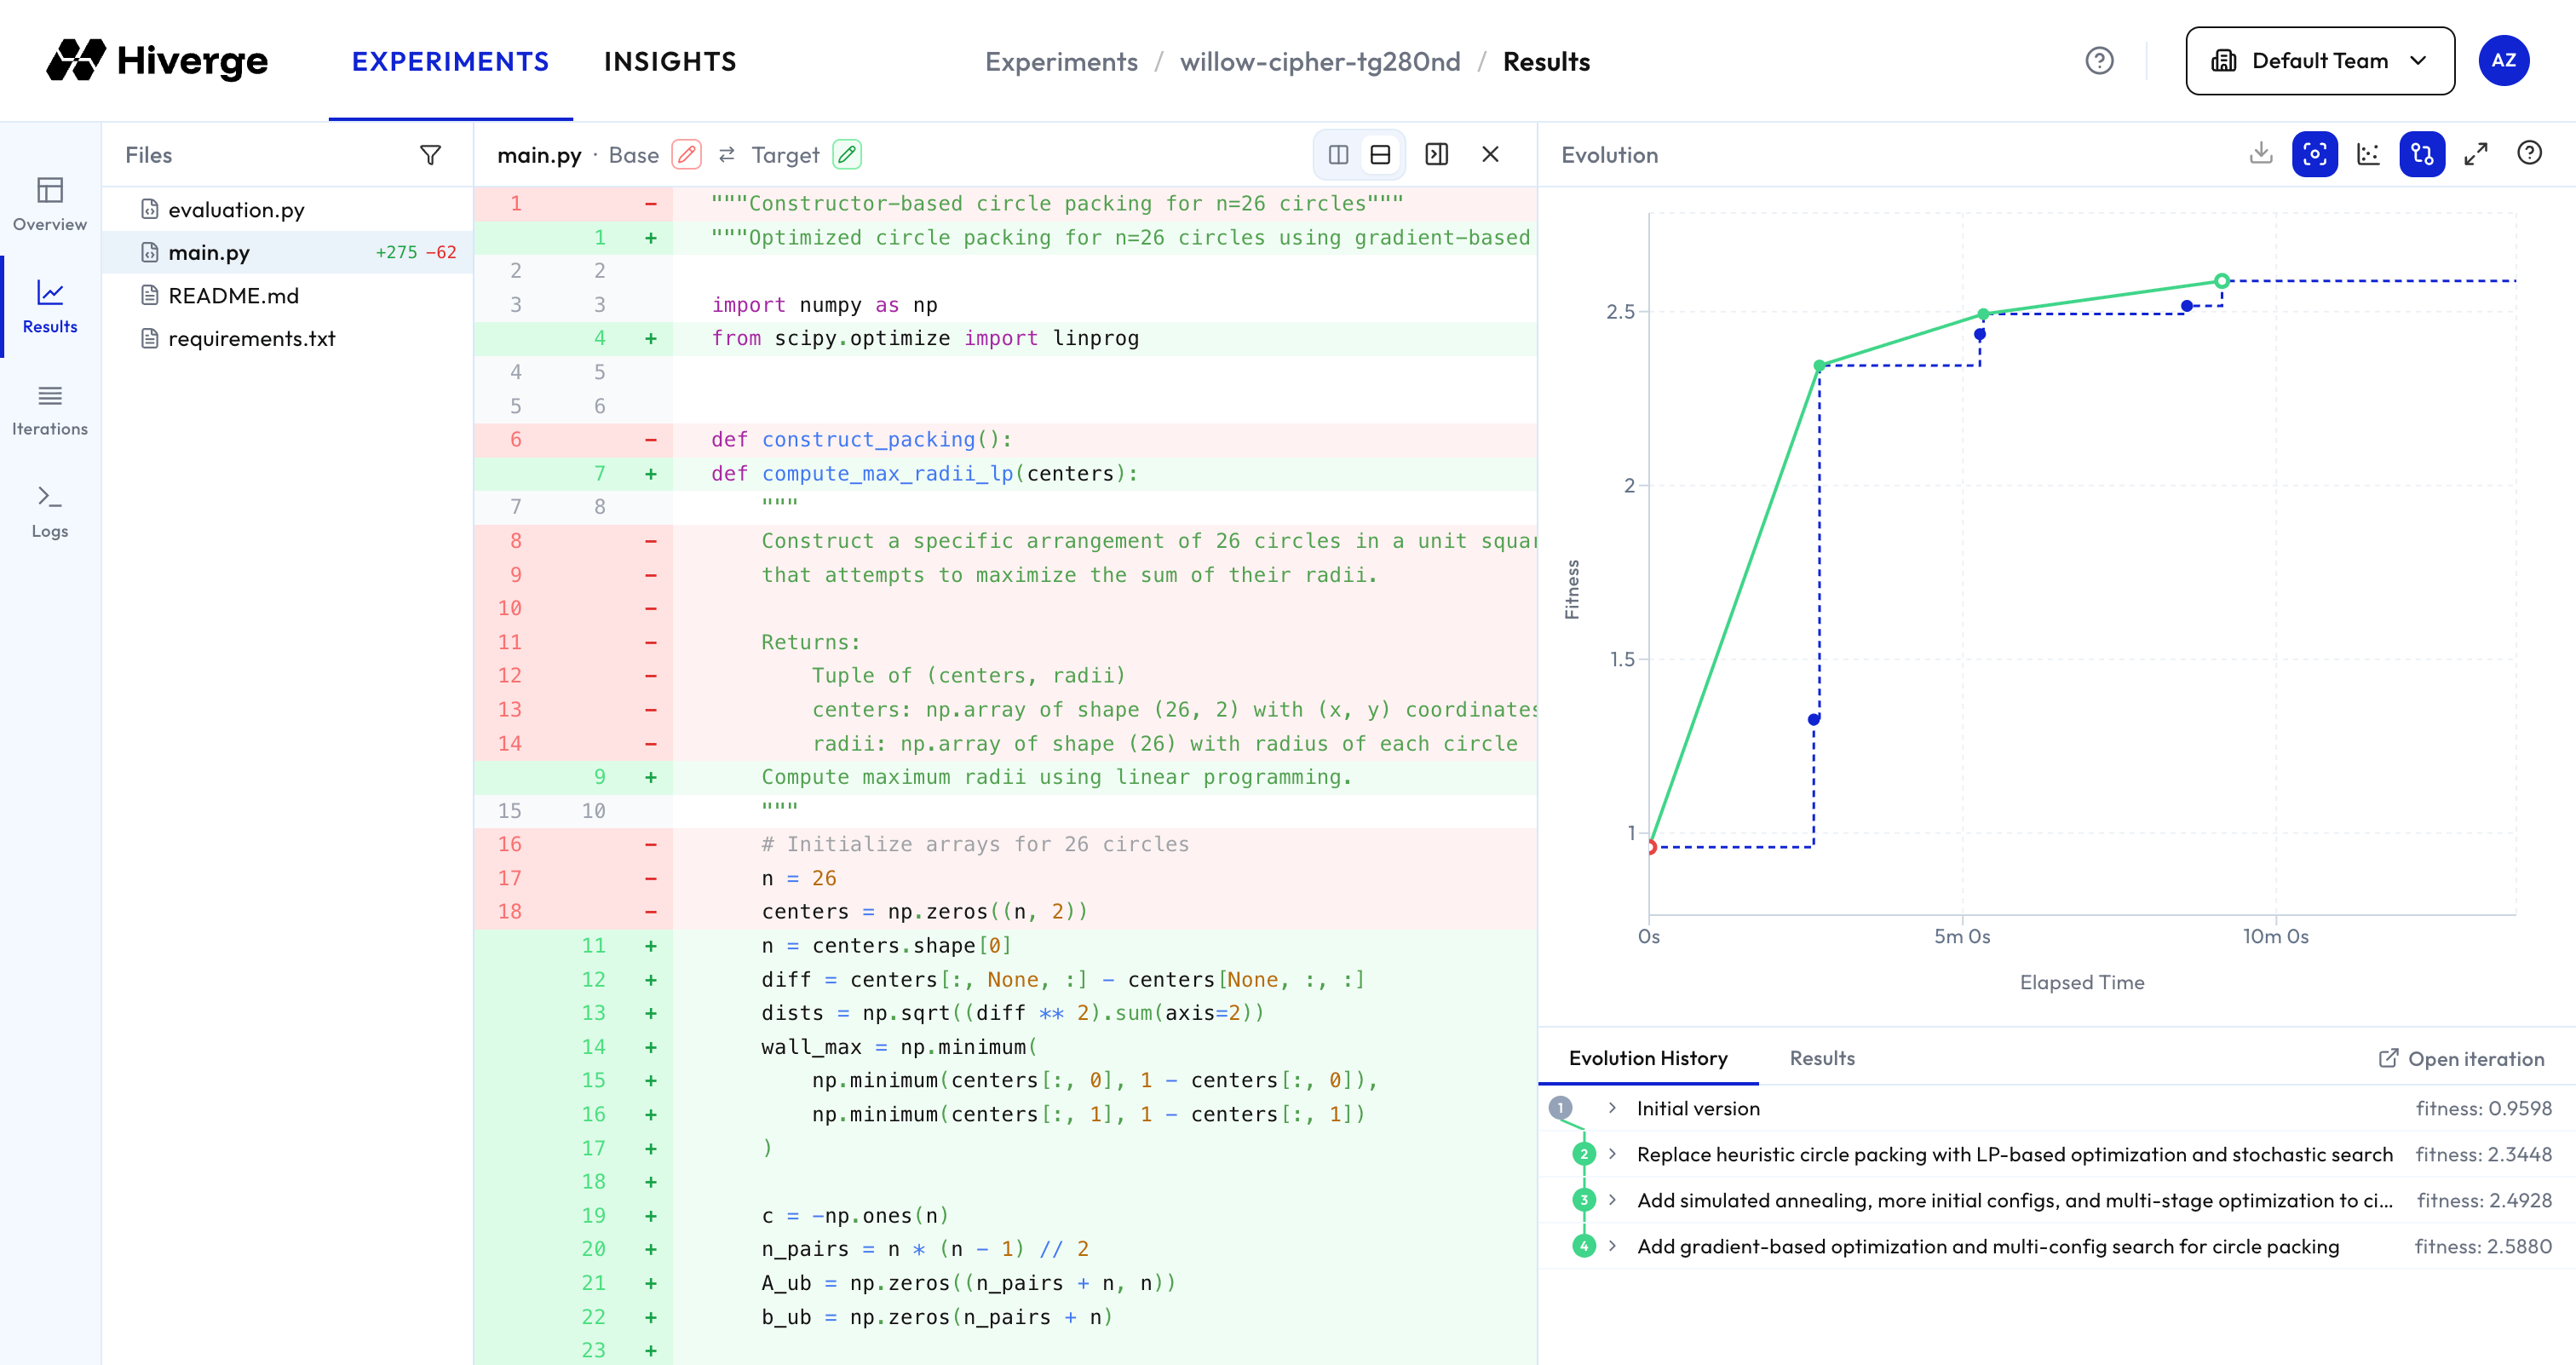 For multi-objective experiments, click the y-axis label to choose which fitness (or linear combination of fitnesses) to display. Clicking the "Evolution" title switches to a view of the Pareto frontier found by the Hive.
 ### Iterations
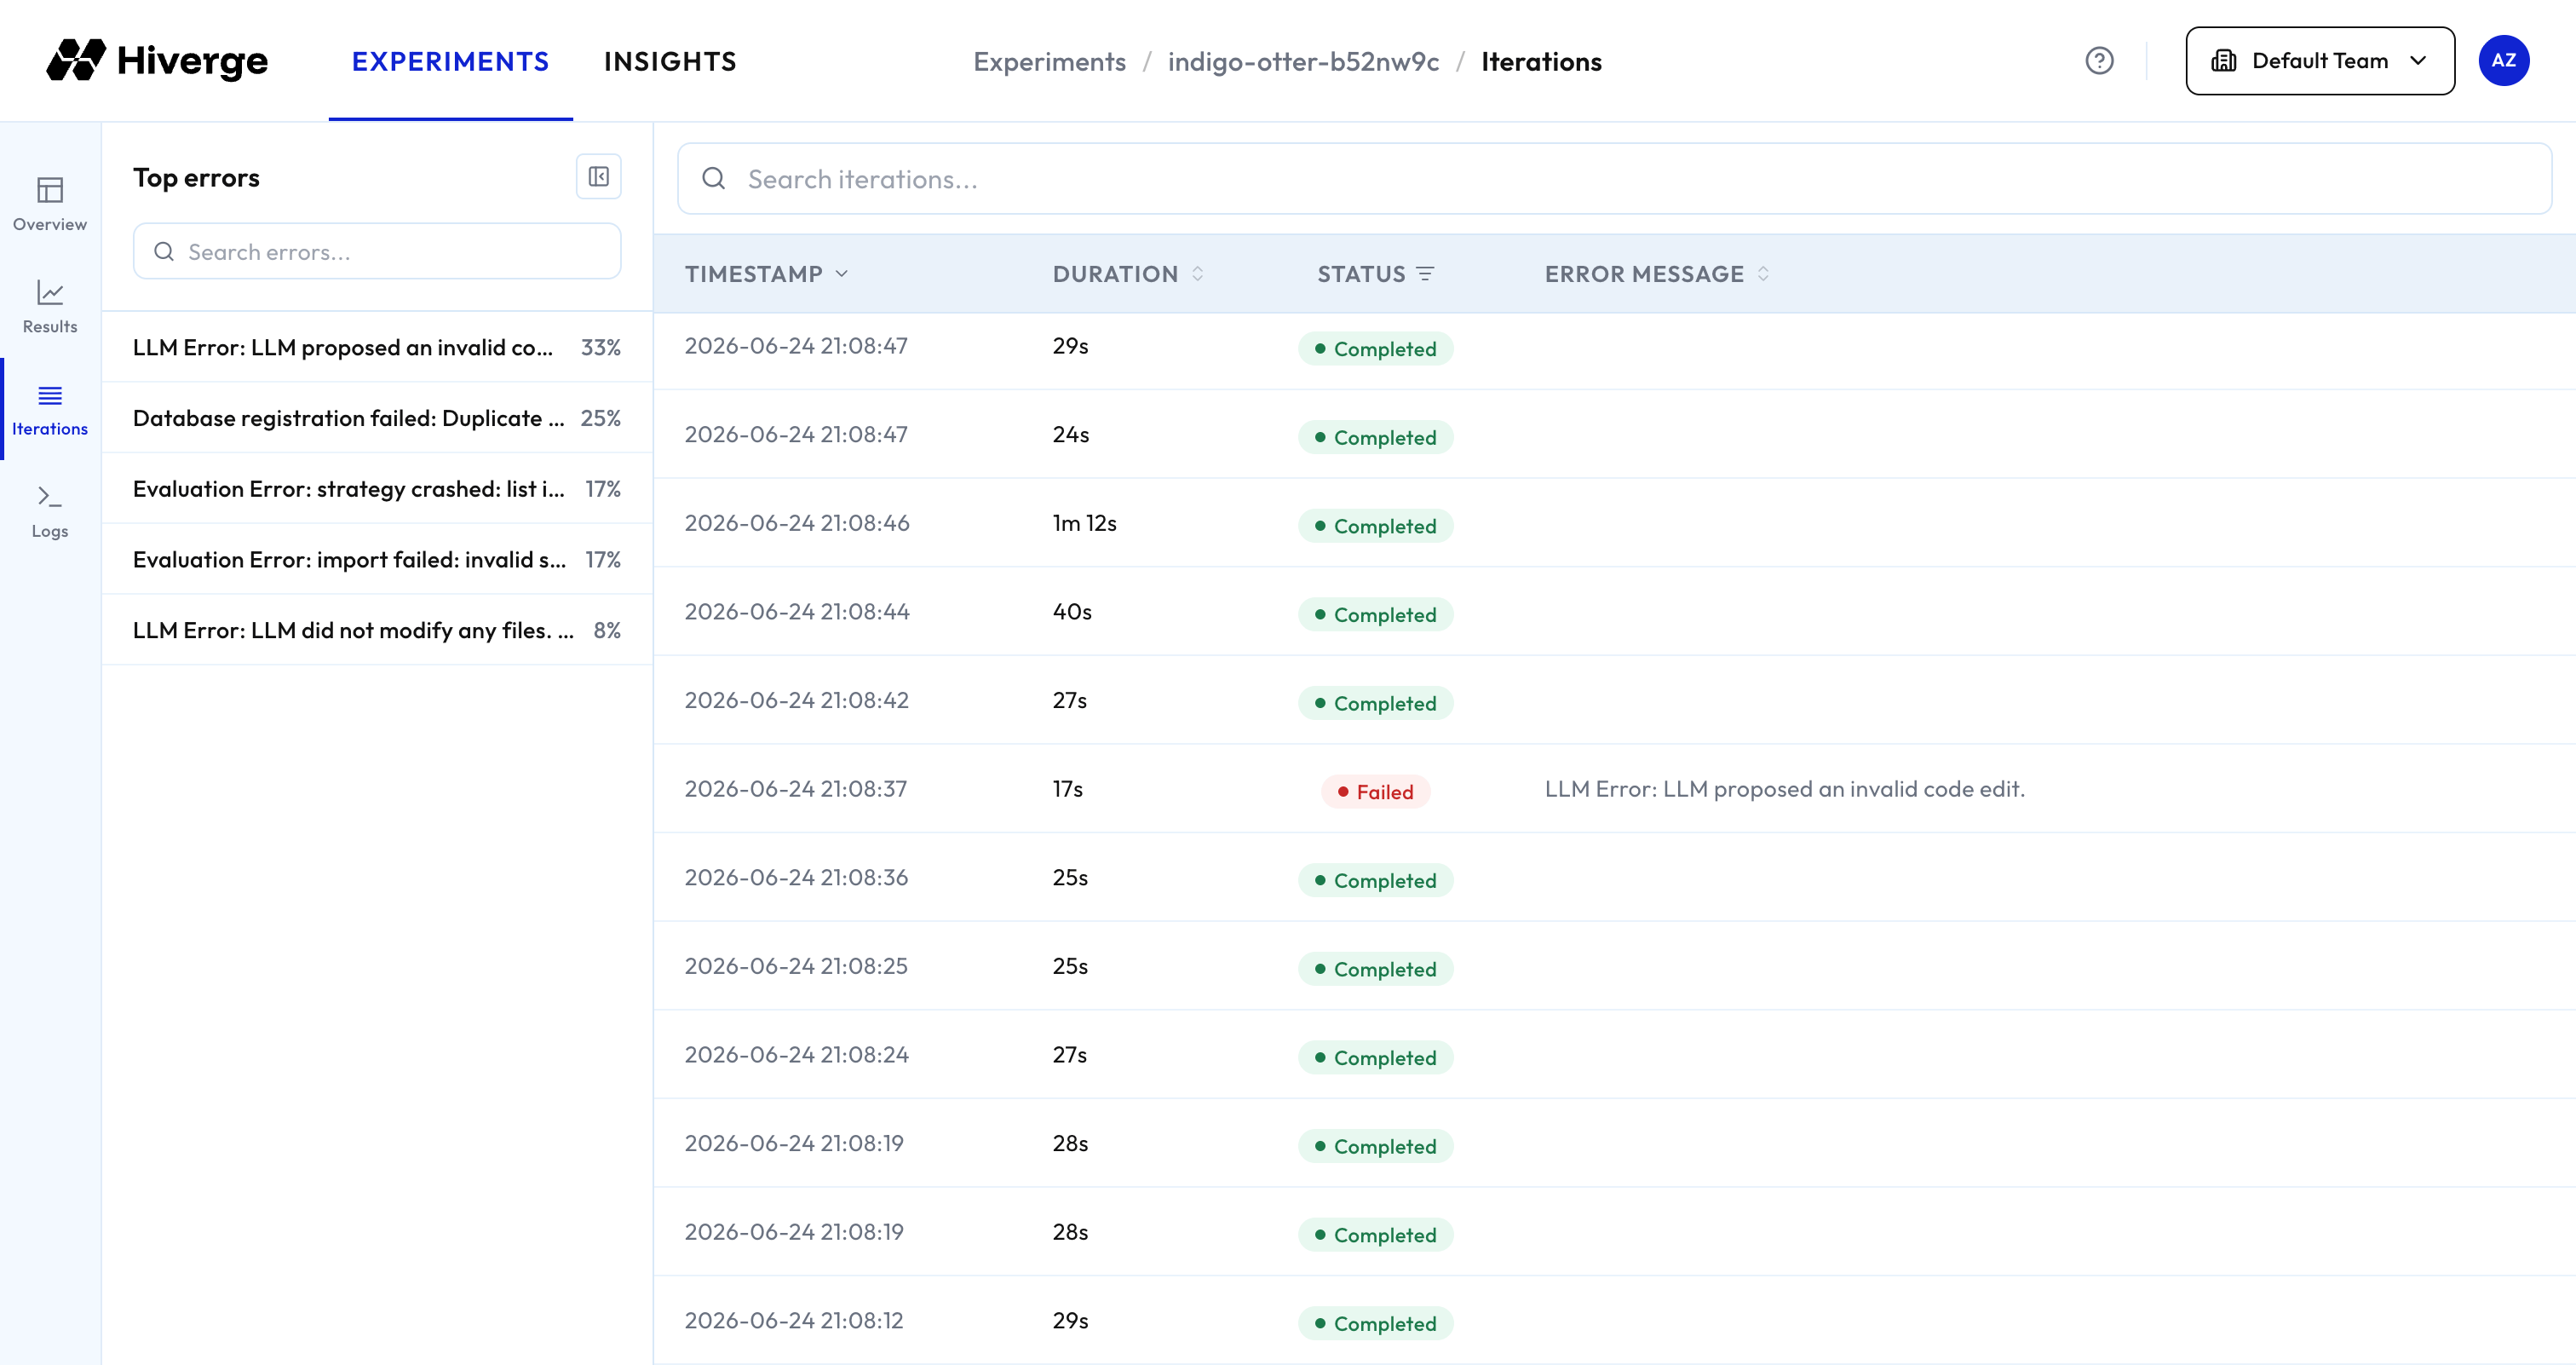
A searchable, filterable table listing every iteration with its status, duration, and timestamp. Useful for auditing specific runs or debugging failed experiments.
### Iterations
A searchable, filterable table listing every iteration with its status, duration, and timestamp. Useful for auditing specific runs or debugging failed experiments.
 | Iteration status | Description |
| ---------------- | ------------------------------------------------------------------------------------------------------------------ |
| Completed | The iteration successfully proposed a new code candidate and evaluated it. |
| Running | The iteration is currently in progress. |
| Cancelled | The iteration was cancelled, usually because the experiment terminated before it completed. |
| Failed | The iteration encountered an error (e.g., the LLM failed to produce valid code, or the evaluation script errored). |
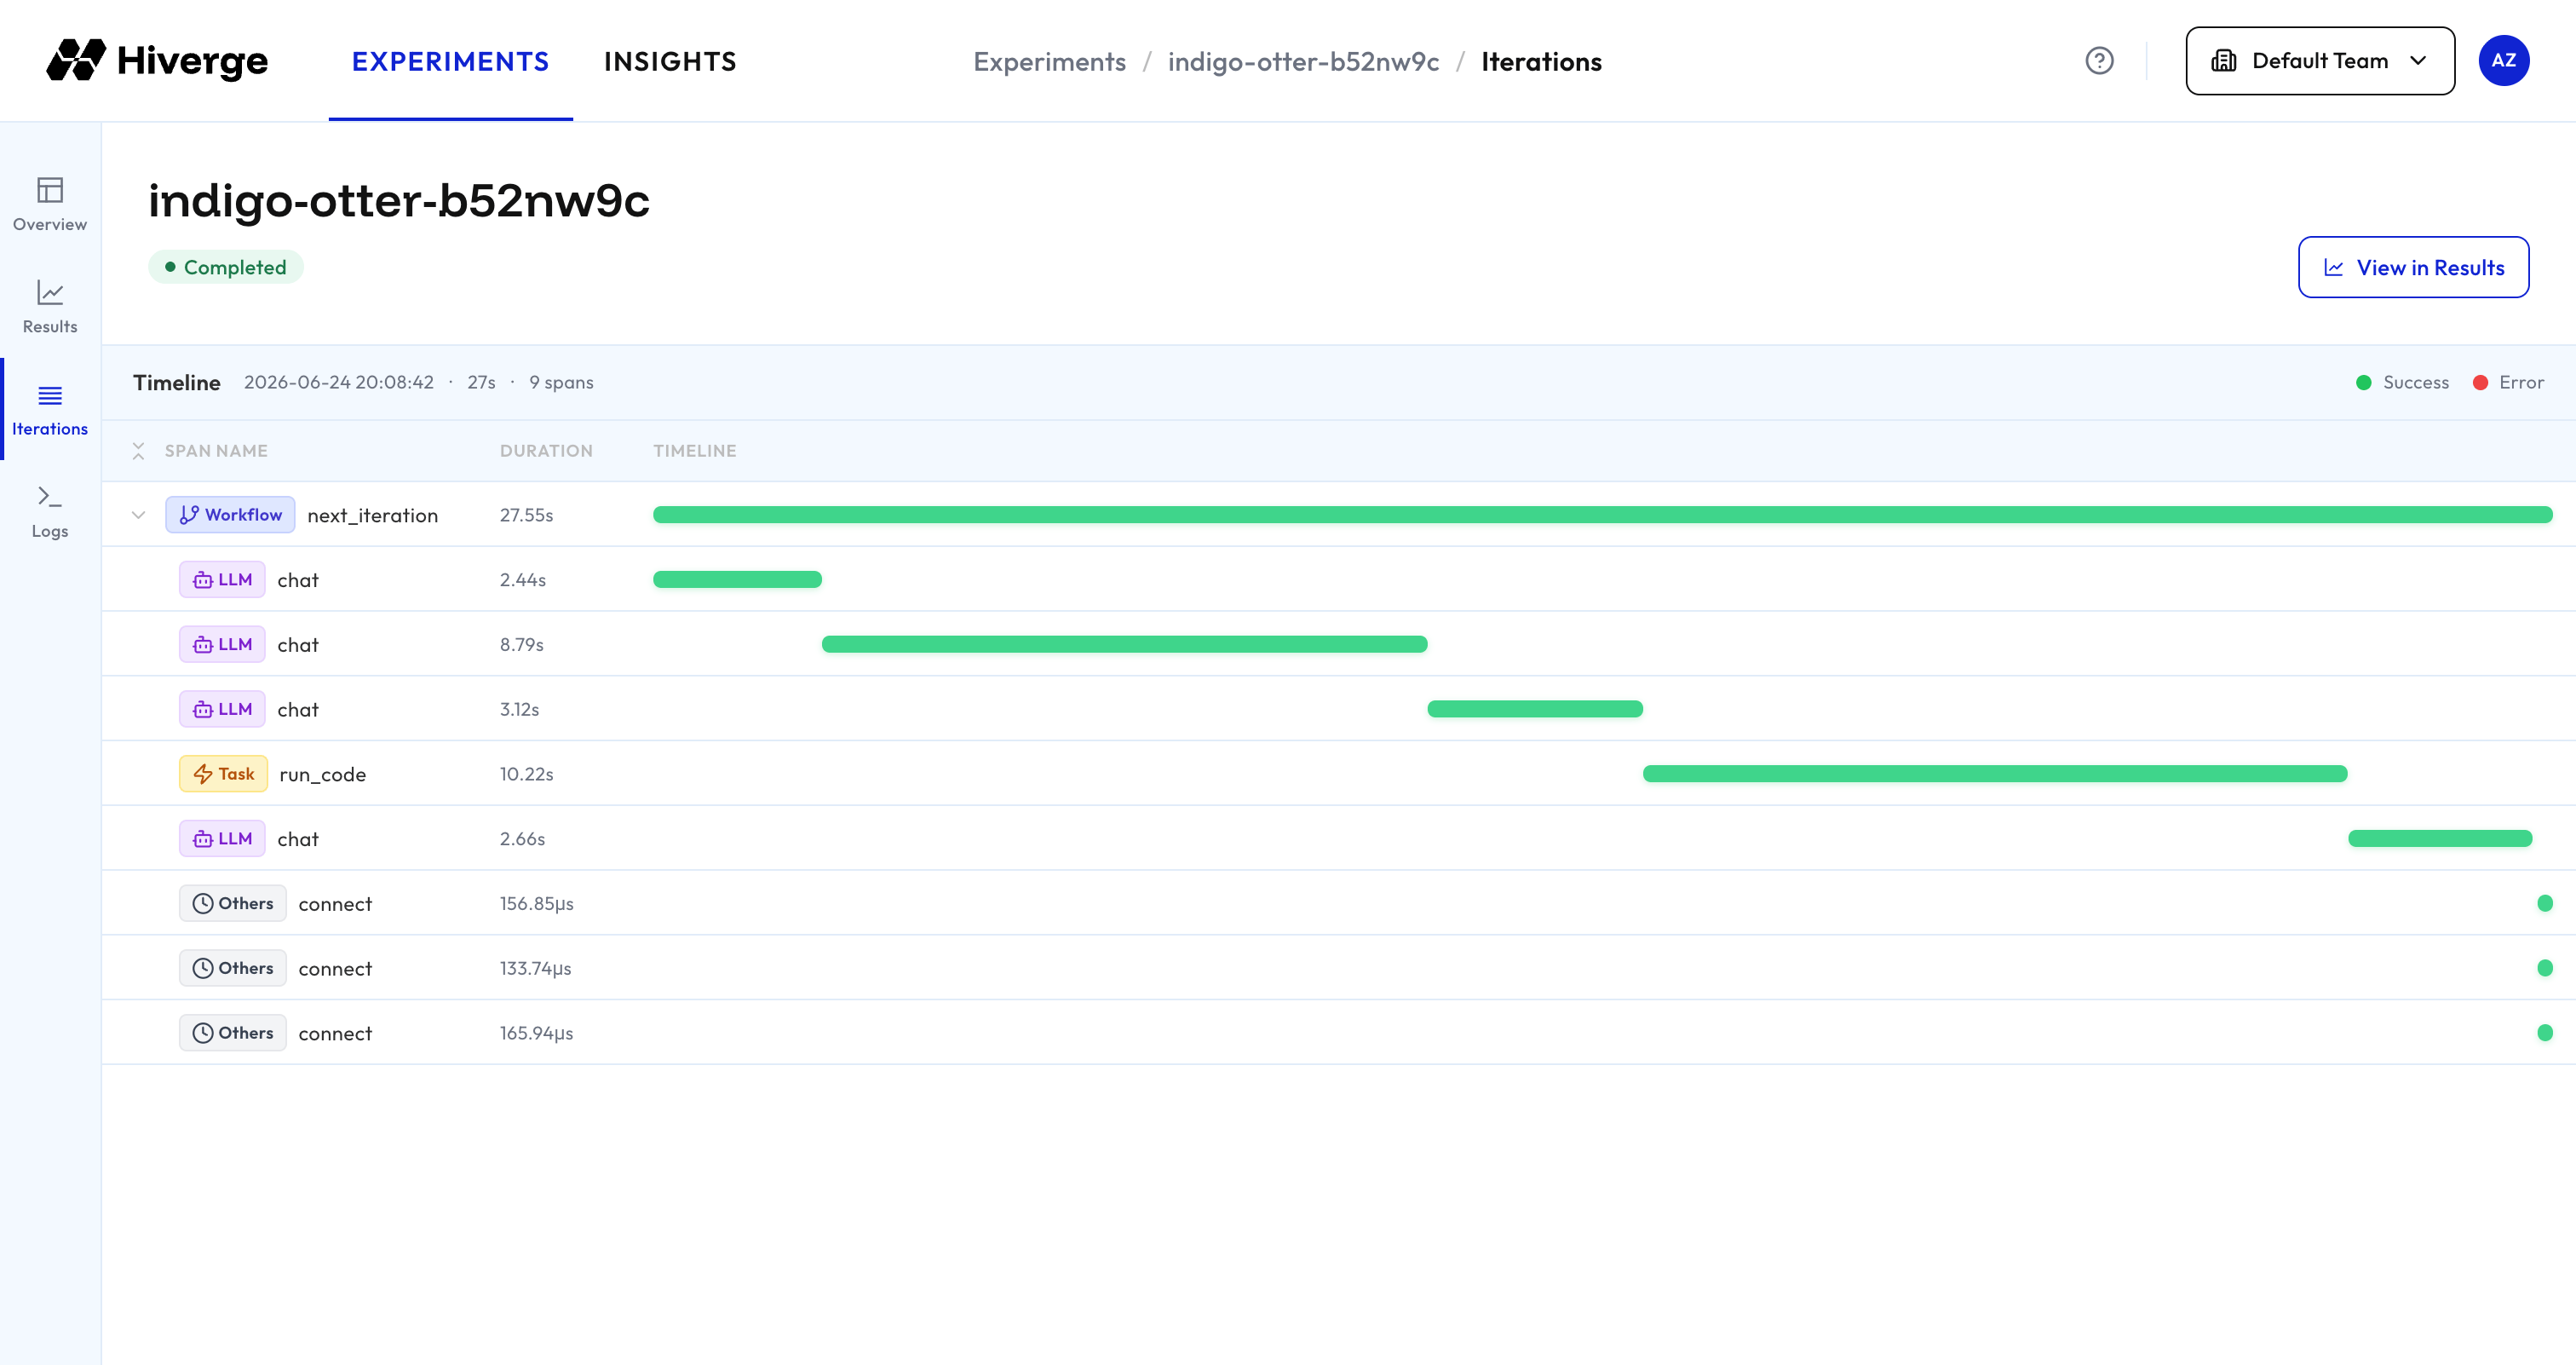
On the left is a window which groups together similar error messages to aid in debugging. Selecting a specific iteration will show more details about the iteration, including the timeline of actions performed.
| Iteration status | Description |
| ---------------- | ------------------------------------------------------------------------------------------------------------------ |
| Completed | The iteration successfully proposed a new code candidate and evaluated it. |
| Running | The iteration is currently in progress. |
| Cancelled | The iteration was cancelled, usually because the experiment terminated before it completed. |
| Failed | The iteration encountered an error (e.g., the LLM failed to produce valid code, or the evaluation script errored). |
On the left is a window which groups together similar error messages to aid in debugging. Selecting a specific iteration will show more details about the iteration, including the timeline of actions performed.
 ### Logs
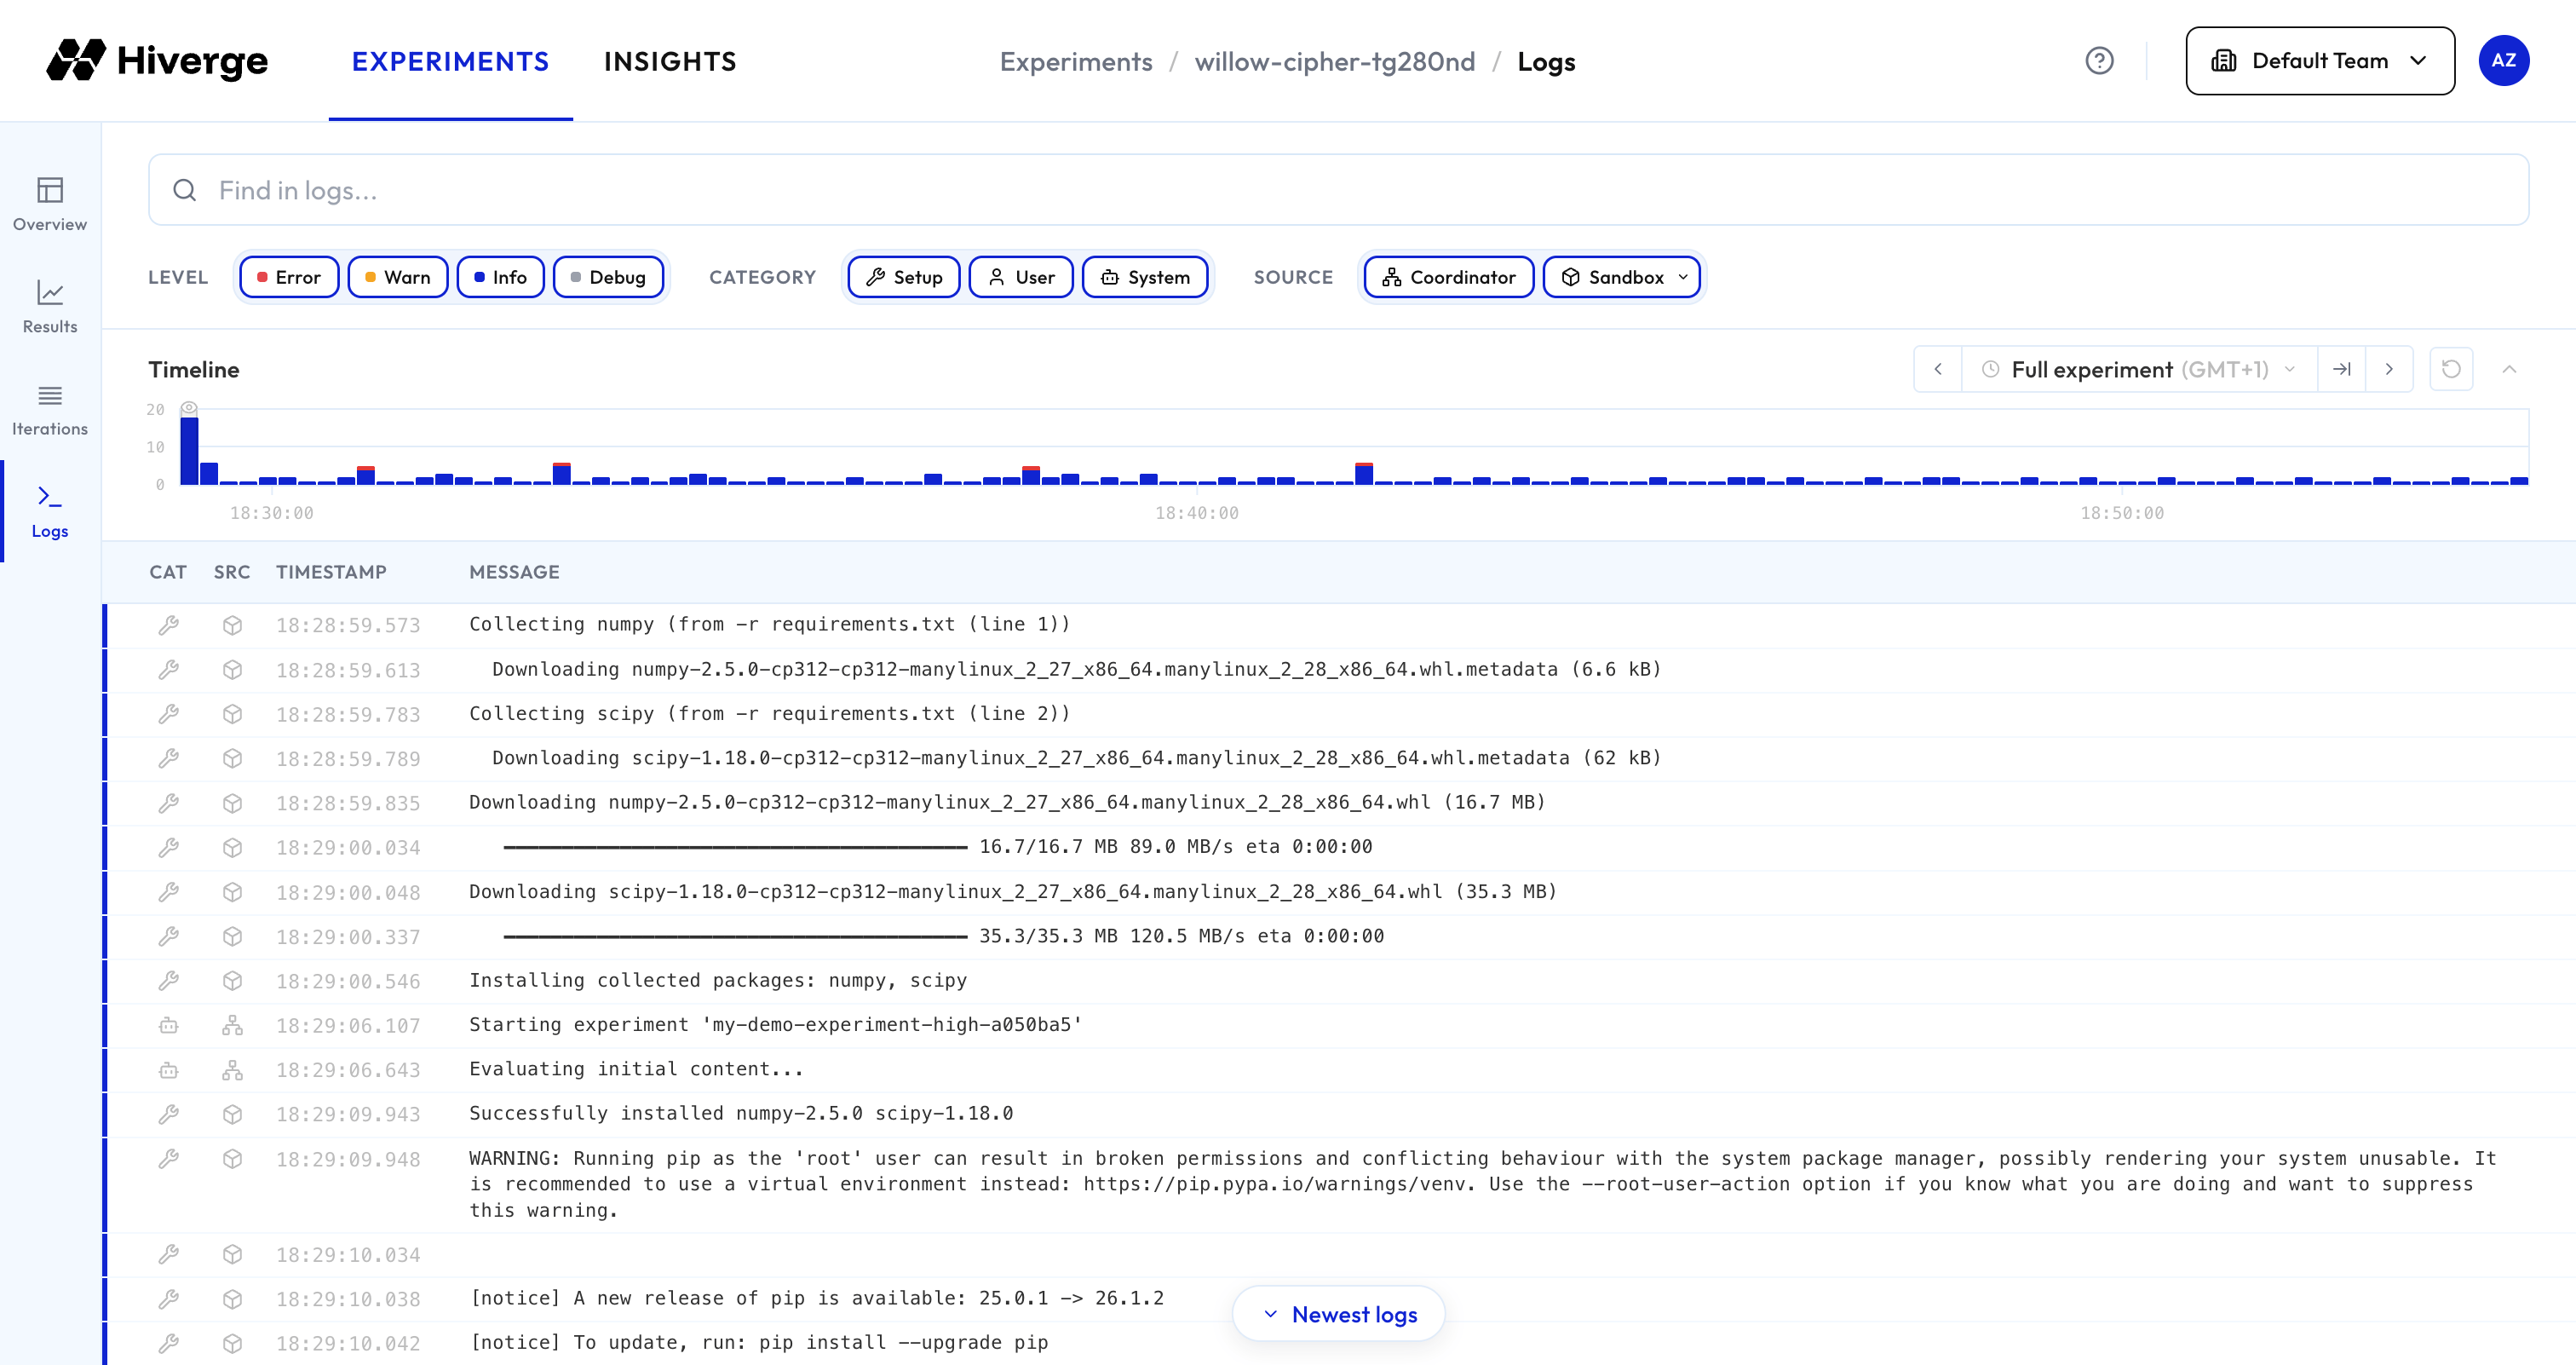
Logs associated with the experiment. There are three categories of logs:
* **Setup**: Output of the setup script specified in `sandbox.setup_script` in the configuration YAML.
* **User**: Any output of the evaluator. You can view any outpout which you print in your evaluator script here to aid in debugging.
* **System**: Logs emitted by the Hive.
Logs are emitted by two sources:
* **Coordinator**: Logs emitted by the Hive itself.
* **Sandbox**: Logs emitted by the sandboxes where the evaluators are run. By default, only logs for a single sandbox are shown. You can show logs of other sandboxes or every sandbox by clicking the dropdown.
### Logs
Logs associated with the experiment. There are three categories of logs:
* **Setup**: Output of the setup script specified in `sandbox.setup_script` in the configuration YAML.
* **User**: Any output of the evaluator. You can view any outpout which you print in your evaluator script here to aid in debugging.
* **System**: Logs emitted by the Hive.
Logs are emitted by two sources:
* **Coordinator**: Logs emitted by the Hive itself.
* **Sandbox**: Logs emitted by the sandboxes where the evaluators are run. By default, only logs for a single sandbox are shown. You can show logs of other sandboxes or every sandbox by clicking the dropdown.
 ## Insights
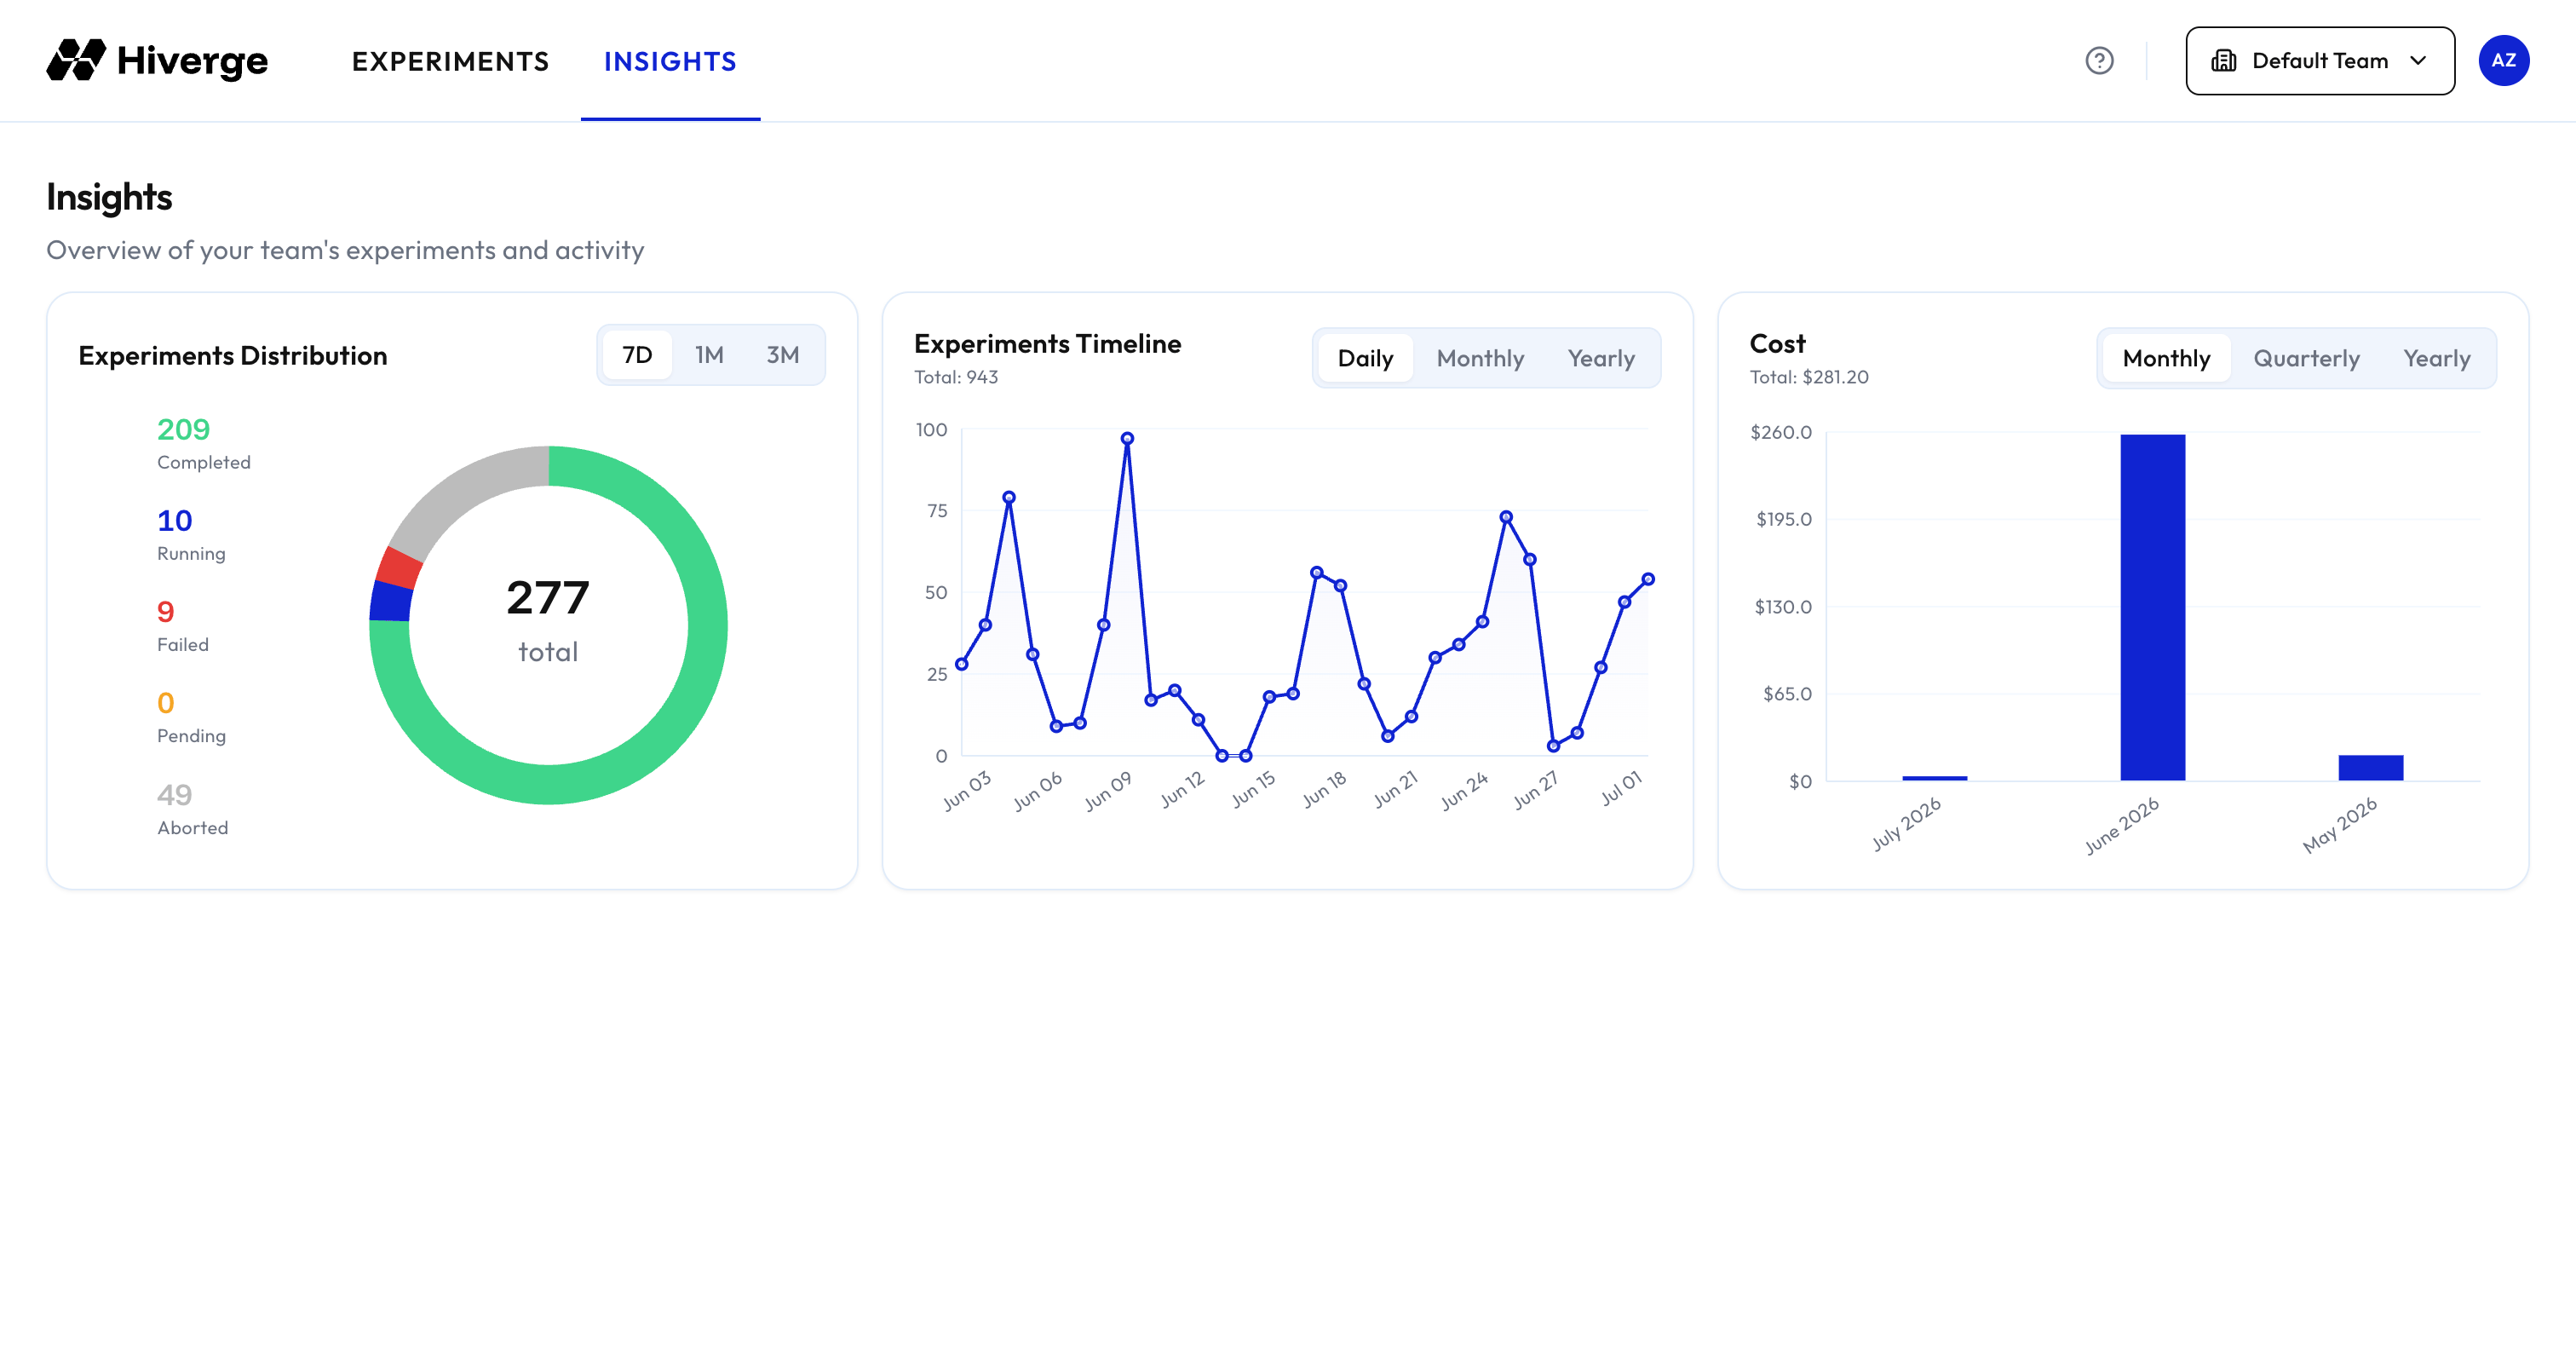
The home page shows a summary of your team's experiment activity. Use the time range selector (e.g., 7 days, 1 month, 3 months) to adjust the window at which the data is shown for.
## Insights
The home page shows a summary of your team's experiment activity. Use the time range selector (e.g., 7 days, 1 month, 3 months) to adjust the window at which the data is shown for.